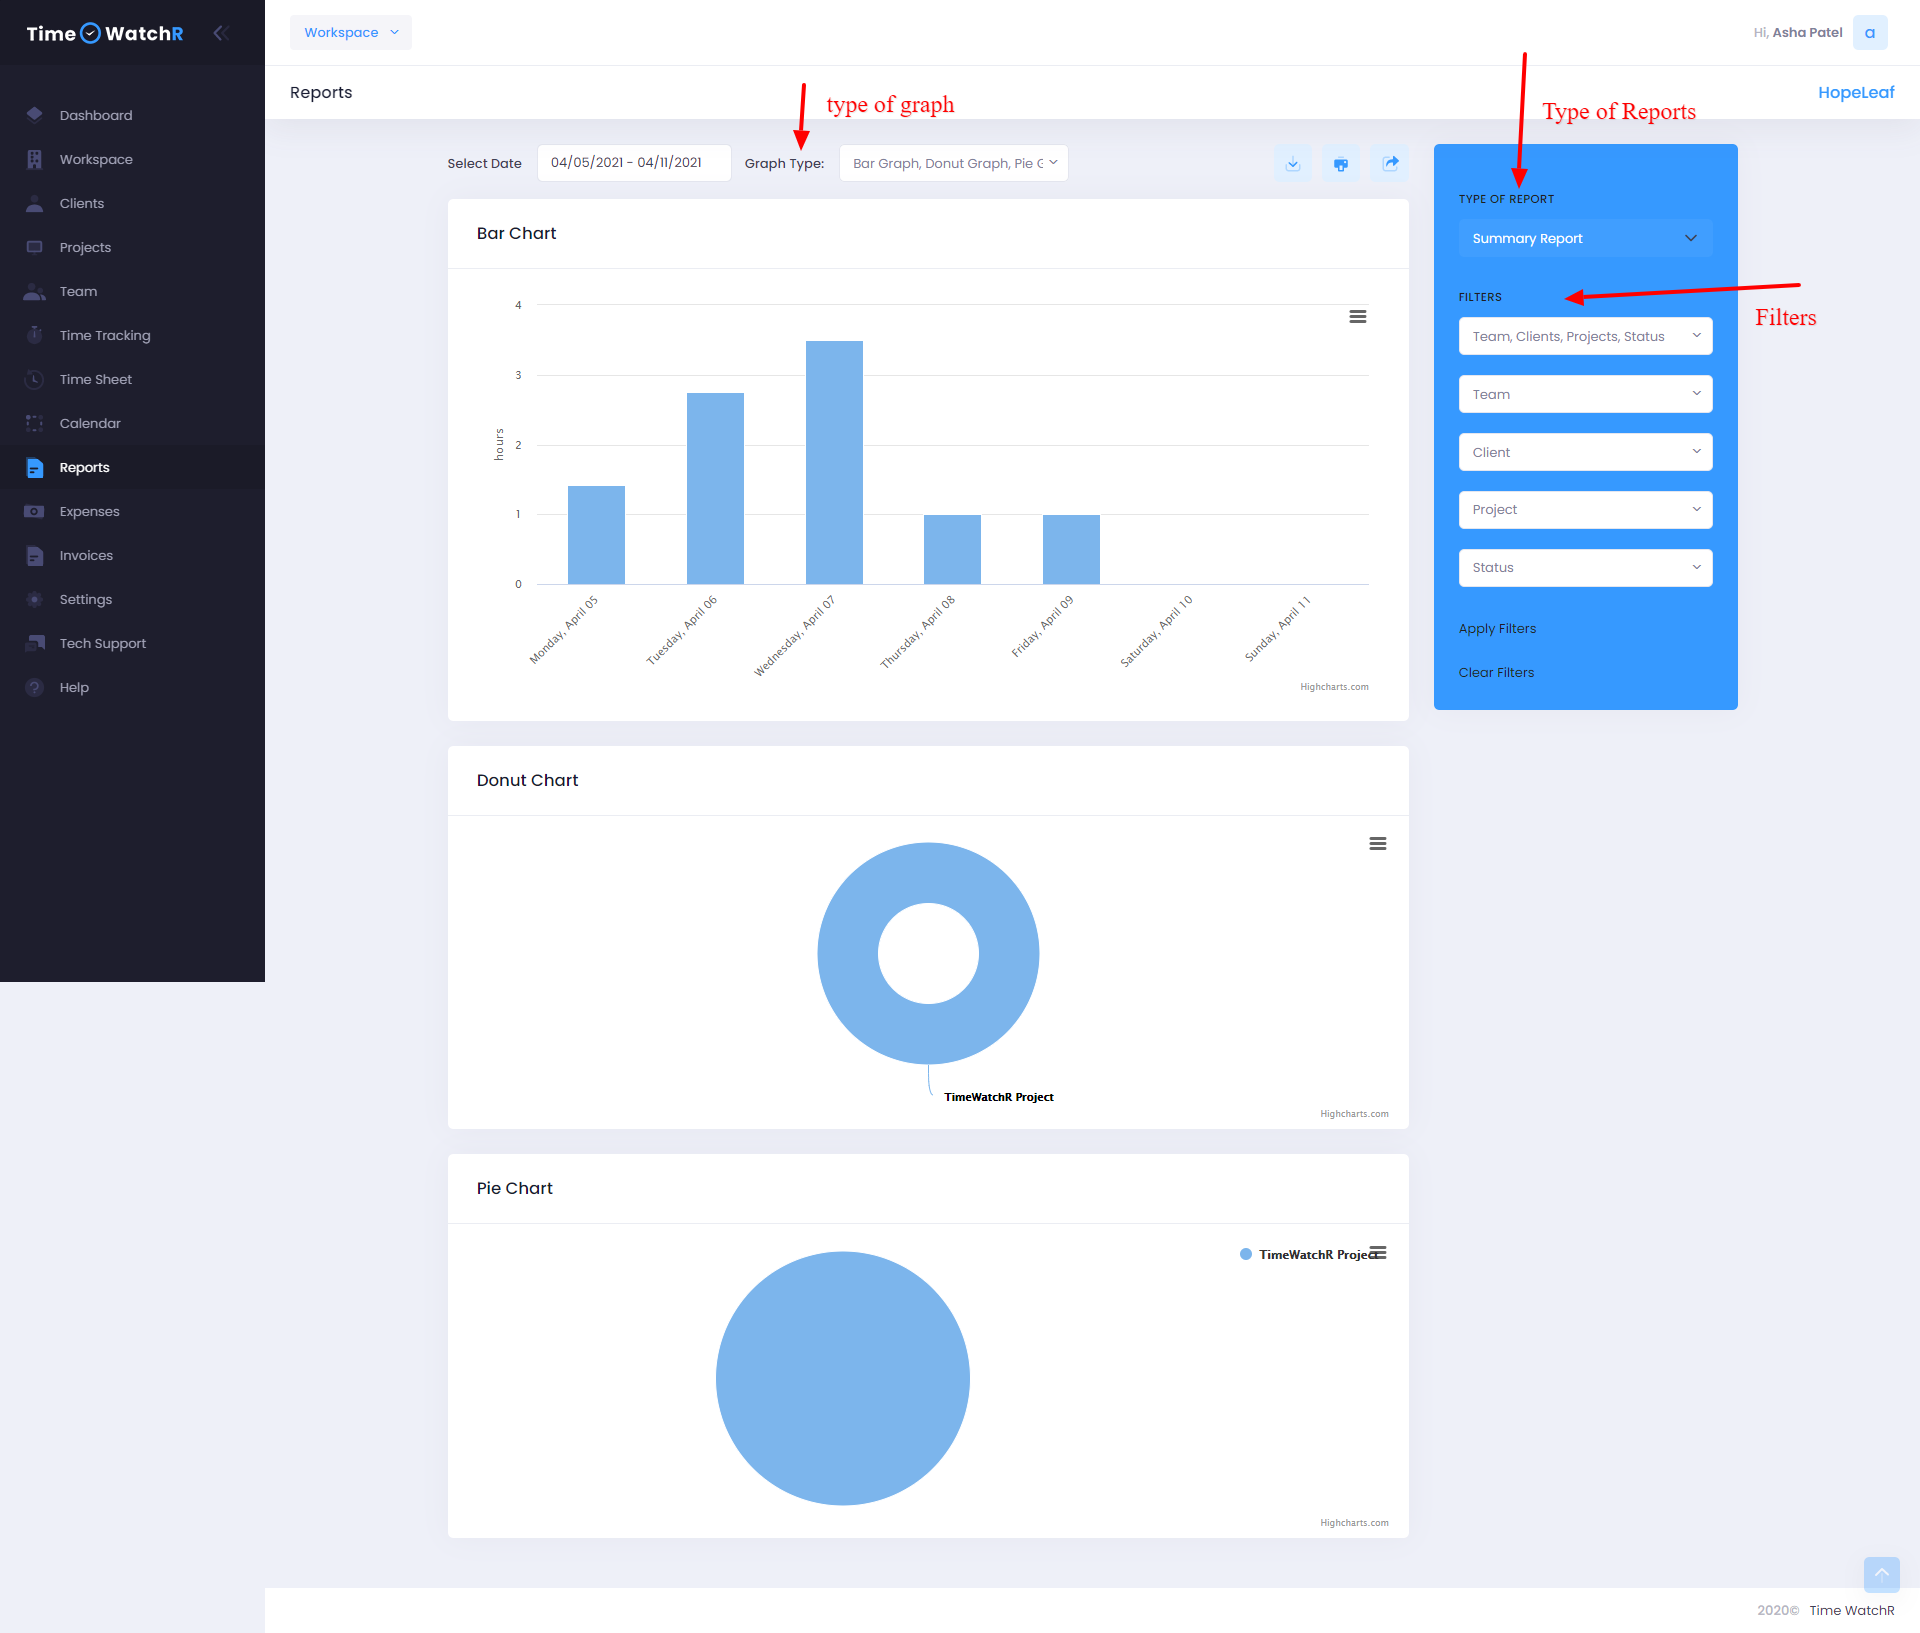
On clicking the ‘REPORTS’ link on dashboard menu, a page with graphs appears. Admin can view reports based on
- Filters
- By Team
- By Client
- By Projects
- By Status
- Type of report
- Summary Report
- Daily Report
- Weekly Report
- Shared Report
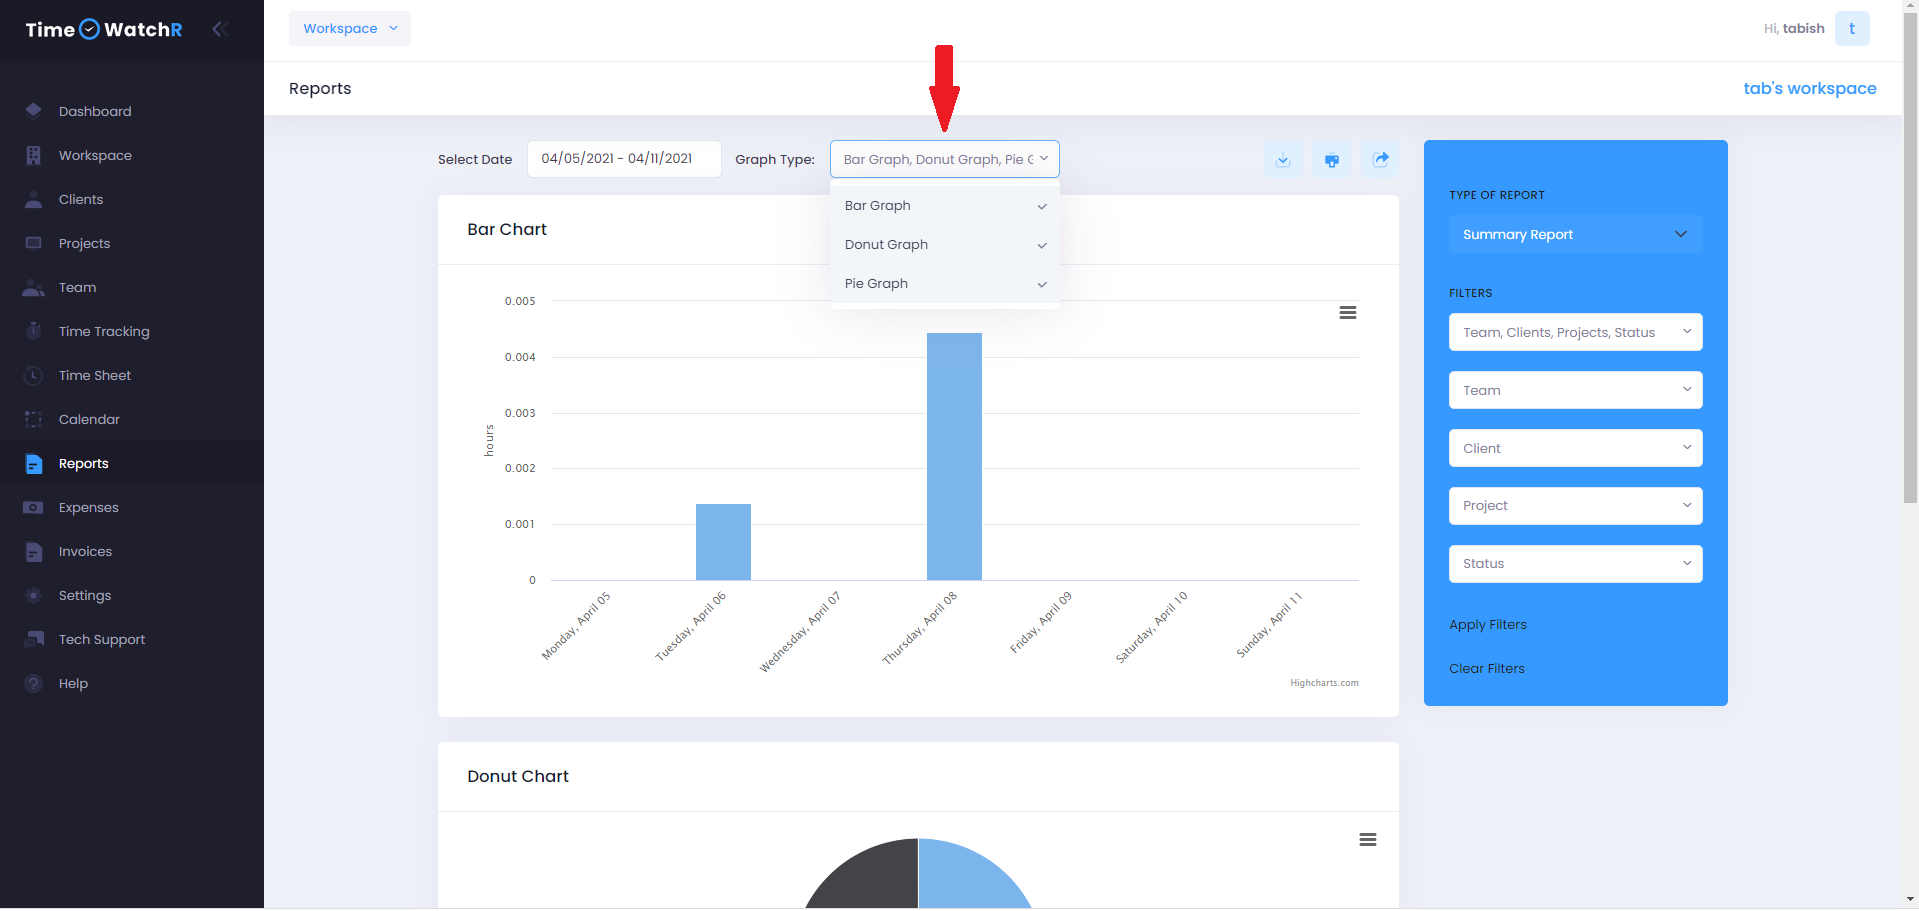
- Type of graph
- Bar Graph
- Donut Graph
- Pie Graph

In the ‘FILTERS’ section, Admin can decide on the fields that can be used as filters by selecting the fields in the list. Based on the selection made, only those fields appear as filters as shown below:

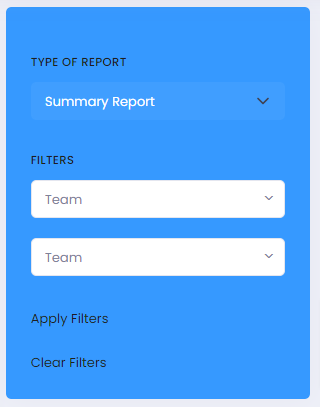
If any field is chosen from the ‘SELECT FILTERS’, only that field appears as a FILTER as shown below:

If all the fields are chosen as filters from the ‘SELECT FILTERS’ dropdown, the filter section appears as below:

In the ‘TYPE OF REPORTS’ section, Admin has the option of selecting the type of report as shown below:

In ‘TYPE OF GRAPH’ section, Admin can choose a type of graph to display as shown below:

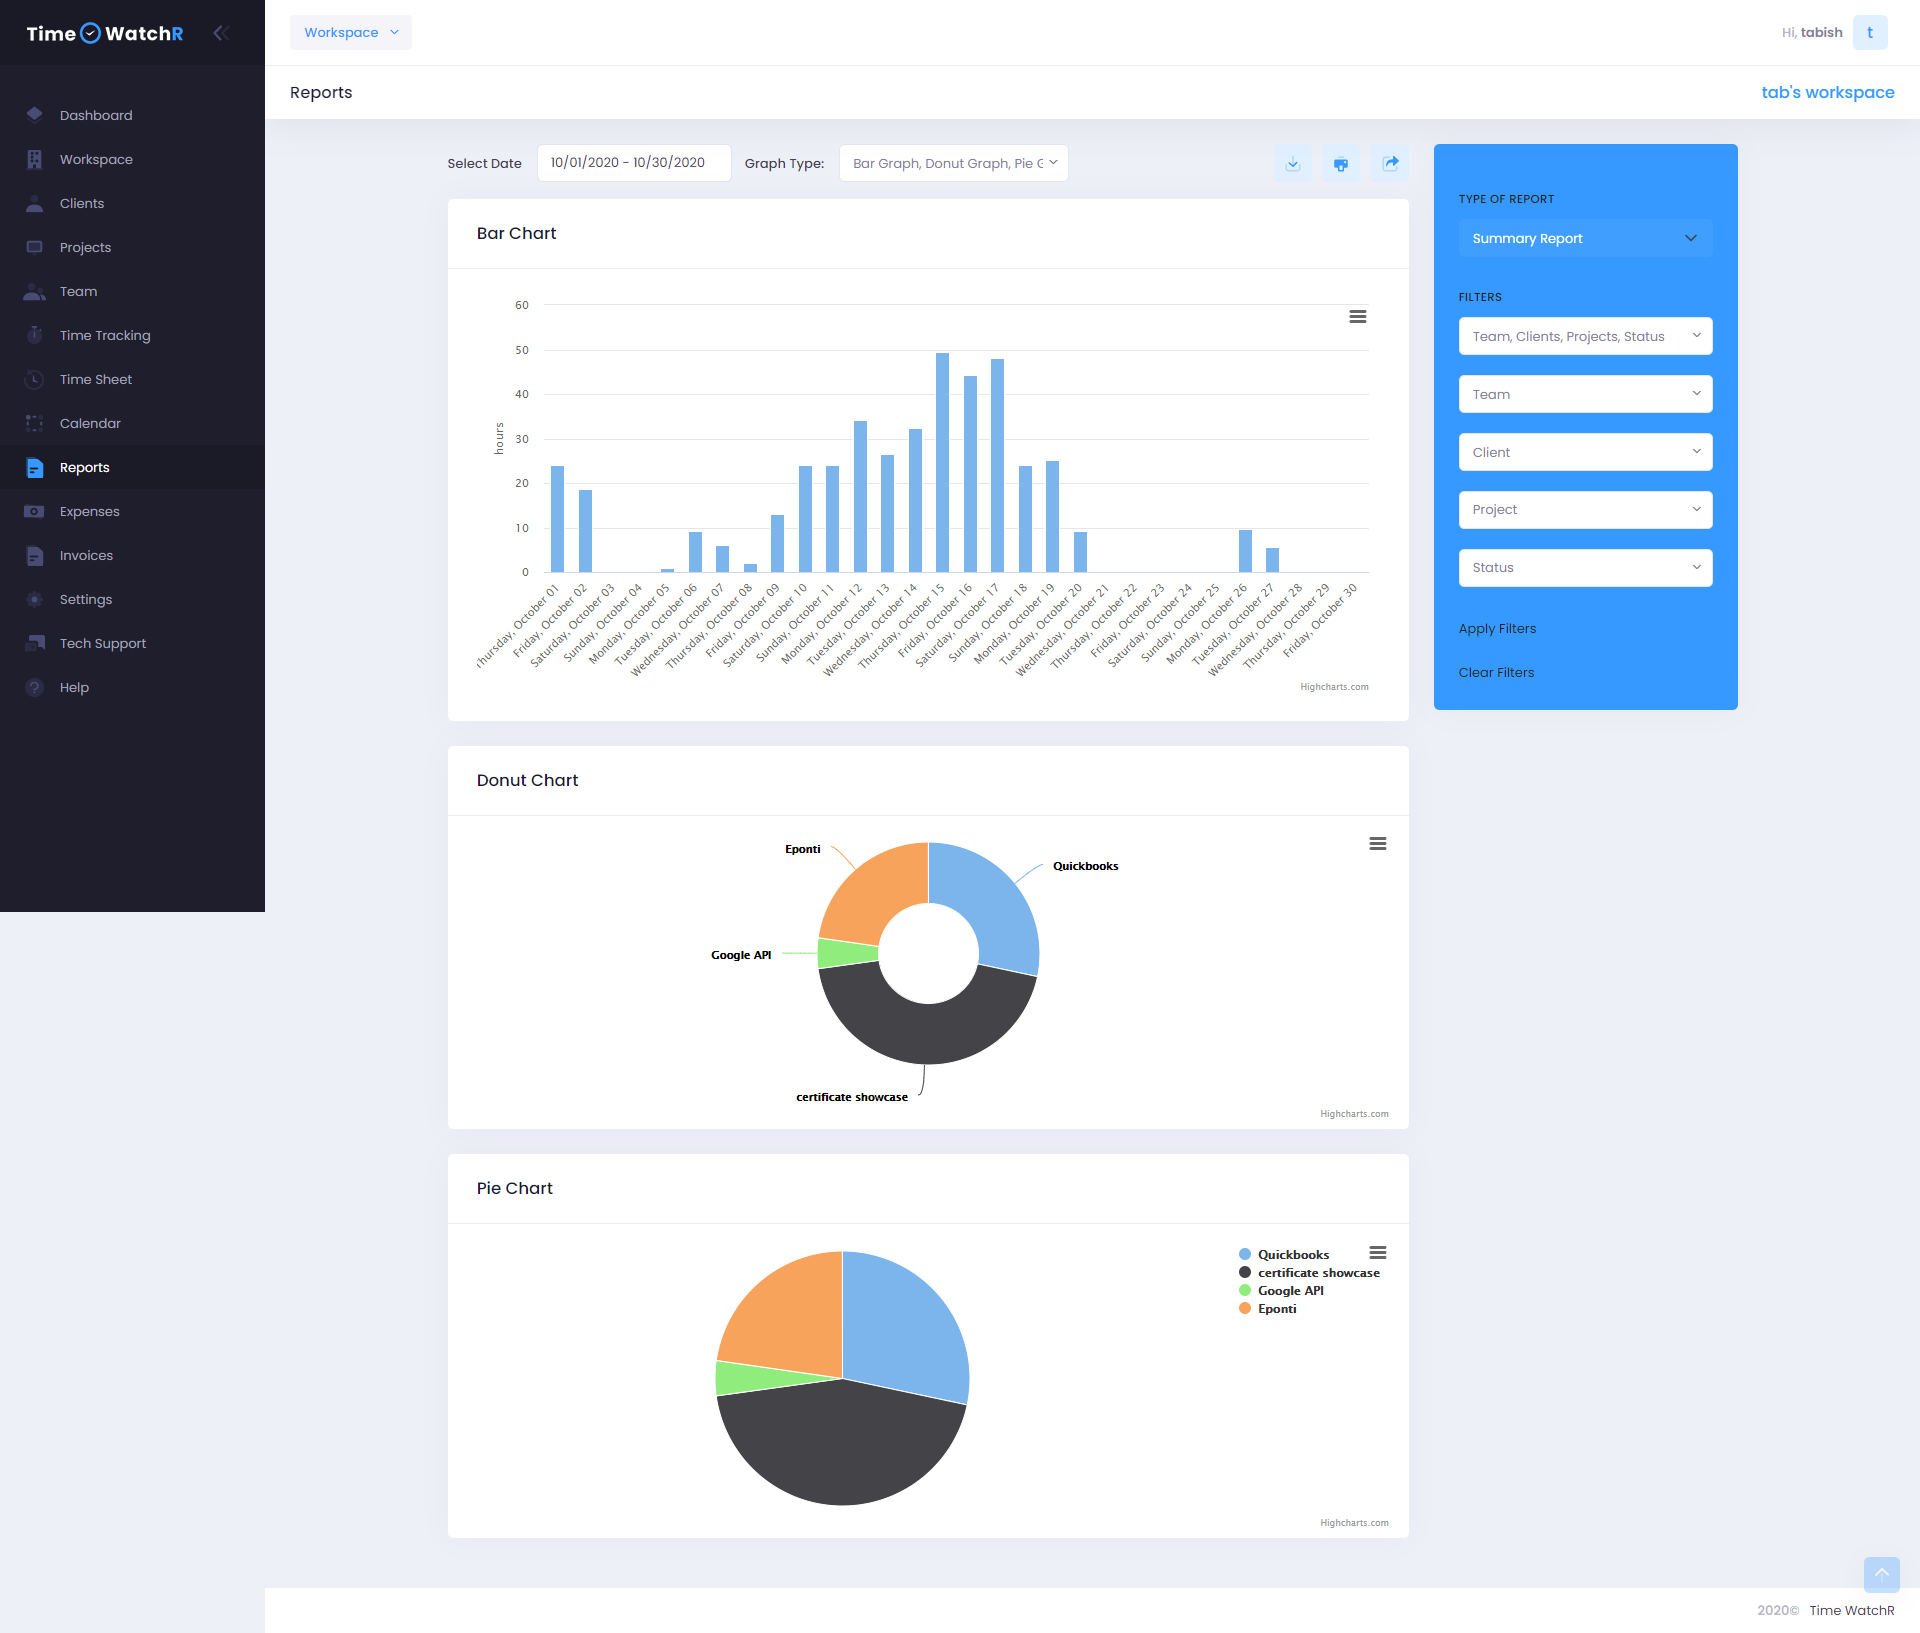
Upon selecting various filters, reports can be viewed. Here is a sample:


